As the world’s only Space technology (‘SpaceTech’) focused venture capital fund, over the last 18 months we’ve been in the privileged position of having a panoptic view of all the innovation that is happening within the SpaceTech ecosystem. To put this in context, during this time we’ve identified more than 1,500 investment opportunities and have used our Seraphim Space Index to track c.250 SpaceTech companies that have raised venture funding.
What we’ve learned from this unrivalled insight is the breadth and depth of innovation that’s happening within the SpaceTech ecosystem is far richer than many people realise, is happening across all segments of the market, and on a truly global basis.
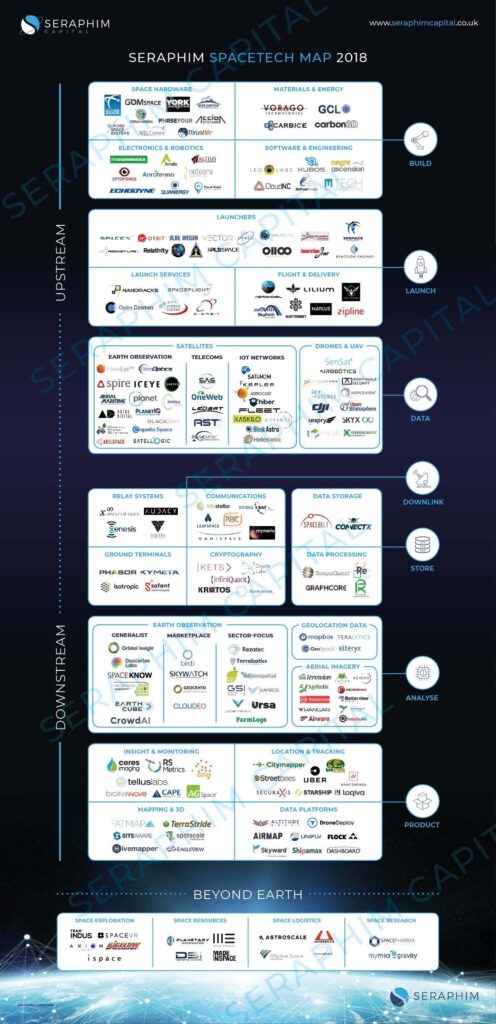
We feel that it is important that the true extent of this innovation is captured in a manner that makes it easily digestible for players within both the SpaceTech and Venture Capital communities. It is for this reason that we’ve decided to publish our own Seraphim SpaceTech Ecosystem Market Map.
Although others have previously attempted their own versions of such a market map, we feel strongly that such efforts have significantly understated the richness of the SpaceTech ecosystem by typically focusing on just the ‘upstream’ (i.e. in-orbit hardware) and ‘outward’ (i.e space exploration) elements of the industry. As some of the most eye-catching segments of the ecosystem, such a focus is perhaps understandable. It does, however, reflect just the ‘tip of the iceberg’ of the innovation that is happening in the broader ecosystem worldwide, neglecting many of the areas which we at Seraphim believe hold the promise of transformational growth.
By aiming to capture the emerging companies at the forefront of the seismic changes affecting the broader Space industry, our own market map aspires to shed some much-needed light on the astonishing levels of innovation occurring in the ‘below the waterline’ enabling technologies right across the SpaceTech value chain.
We hope that our market map helps paint a clearer picture of what is in our view a still nascent, but nonetheless thriving ecosystem. Although ‘New Space’ may yet to have reached a true inflexion point, we believe the richness of this burgeoning ecosystem is indicative of what we see as being a multi-decade, macro trend.
To use yet another maritime-based analogy, collectively we believe the current wave of innovation occurring in SpaceTech could yet become a tsunami. Right now, that tsunami may appear as a mere speck on the horizon. Over the forthcoming years, we expect momentum will continue to grow and that as and when this tsunami does truly break, it will unleash a wave of disruption the effect of which will be keenly felt far beyond just the $350 billion Space sector itself.
————————————————————————————————————————————
A word on our taxonomy and how we have looked to categorise each company. We have designed our market map to reflect our own definition of the SpaceTech ecosystem. This follows our framework for the data lifecycle as illustrated in our infographic here. This aims to cover our core investment thesis of backing businesses that observe, connect and guide the Earth from above. At a high level this data lifecycle encompasses the following:
- Build: building and selling satellites / drones – components and sub-systems
- Launch: delivering payloads into space, launch services and drone delivery
- Data: multi-modal data platforms using satellites / drones – collective, communicate, navigate
- Downlink: facilitating transmission of data to the ground
- Store: data storage, processing, high-performance computing
- Analyse: analytics on data collected from satellites / drones
- Product: packaging of different data streams into vertical-specific products and platforms
Importantly, we include drones and other similar airborne platforms within our ecosystem not only because they share many of the same attributes of smallsats (i.e. leveraging commercial off the shelf technology, sensor miniaturisation, convergence of A.I. and cloud computing etc), but also because we frequently see a combination of such space-based and airborne platforms being needed to solve customers’ most pressing pain-points.
We have limited our market map to just start-ups / emerging companies rather than looking to include some of the large incumbents that undoubtedly also play in this market. We acknowledge the limitation of this, as we do for having taken the difficult decision for the sake of simplicity to include each individual company in just a single category, in spite of the fact many are active in multiple different market segments. In each instance, we have sought to try and categorise each business on the basis of whatever we perceive as being the core element of their proposition. For example, any businesses collecting and/or communicating data from above this has meant categorising them in the ‘Data’ segment.
We have not sought to include every company we’ve identified in our map – it is just a relatively small sample of the 1,500 businesses we’ve engaged with to date. We will be looking to update the market map periodically, so we’ve love to hear from any companies that we may have overlooked or any that feel we have positioned them incorrectly in the map.